The "Most Meaningless Friedman Graph" Contest Winners, Remembered
With another Friedman contest underway, a shout-out to the entrants of a contest from ages ago, which prompted over 3,000 submissions

In the just-published “Thomas Friedman Roars Back to Form,” I introduced two contests, one for the best plan for Vladimir Putin to get out of a tree with a set of tools, and another for the best drawing of Friedman’s Putin complicated Putin imagery. In asking for entrants to tweet submissions to #FriedmanTreePlan and #FriedmanImage, respectively, a subscriber was upset that the use of Twitter was required, which I get.
I responded that the reason was that an old contest, “Make the Most Meaningless Thomas Friedman Graph,” produced inspired submissions, and left a link in the results. But the link is paywalled, producing more complaints, which I also get! So in the spirit of being full-service, just wanted to reproduce those winning results here.
The contest was in response to a pair of graphs Friedman made in Thank You For Being Late. The first plotted against X and Y axes of indeterminate value where “we are” in history versus where “human adaptability” is headed:
The second explained that the solution to our problem is to just move the adaptability line up to meet the “We are here” data point:
Friedman’s “solution” graph appeared to involve time travel, but this was the least of its problems. As Matt Novak at Gizmodo wrote:
The graph shows technology (which is never defined) and its rate of change (which is never defined) and human adaptability (which is never defined). It’s the kind of thing you might see scrawled in feces in Ted Kaczynski’s prison cell but it’s now been conveniently committed to paper and given a much wider audience.
I offered a “Respect the Stache” t-shirt to anyone who could make a more meaningless graph. Thousands responded, and I had ended up giving shirts to a lot of people. I don’t have all of the images — troublingly but perhaps not surprisingly, some of the winning accounts have been deleted — but here’s a sample:
@mollyhinshaw: “Whether Foucault’s pendulum is swinging north or south” vs. “Space-time anomaly” vs. toast was pretty self-explanatory:
@fififerenghi, “Speed of Rolling Donut vs. Number of Attempts at Airborne Copulation With Donut (United States)”
@leafbeetle, “Height-Quantity-More-Fewer-Lower-Higher,” Ducks in “Sounth”
@bosco_hoggins “Use of the term ‘Innovation’ vs. Understanding of Technology as determined by Self Regard”
Note that “Brother-in-law after watching The Social Network” is higher on the graph than “TED talk.” Inspired.
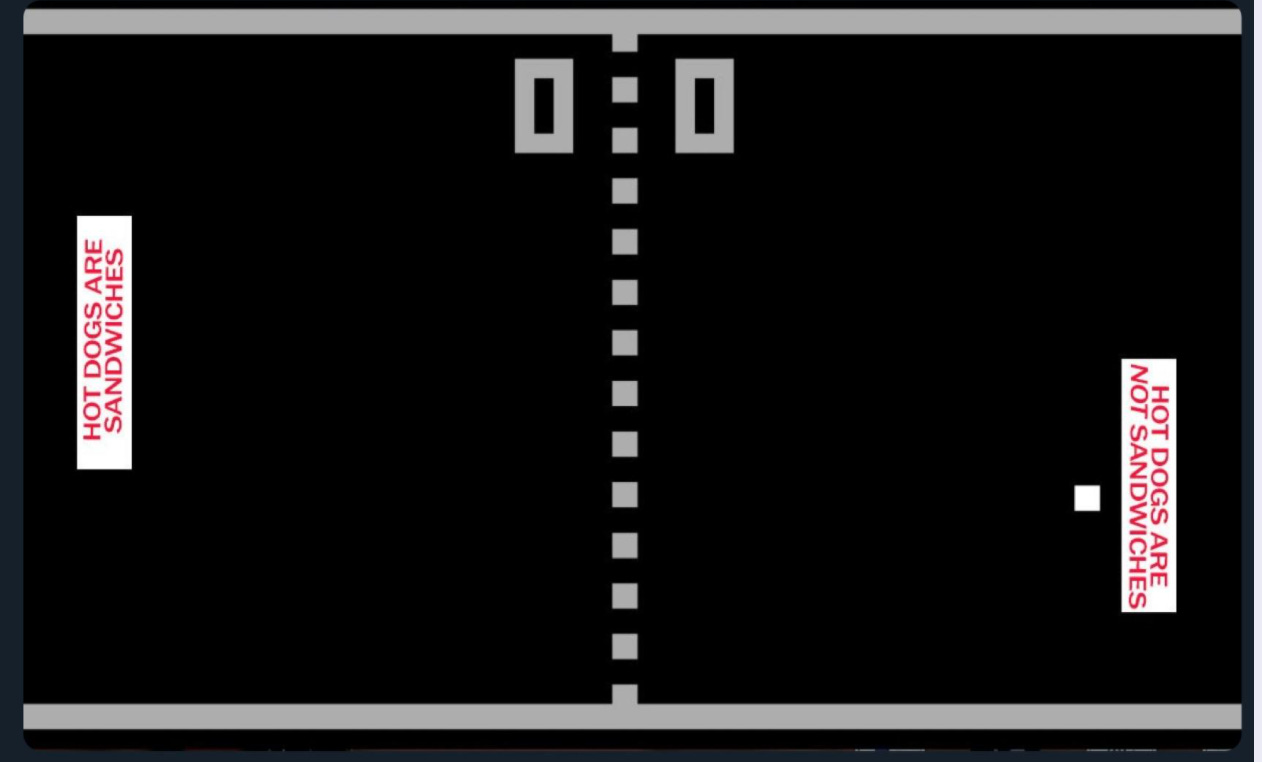
@zackpierce821, “Hot dogs are a sandwich vs. hot dogs are not a sandwich”
@vulturechow, “Quality of Thomas Friedman’s Book vs. Likelihood that my father will give me the book for Hannukah”
@frisbeepilot, “Number of Downs: NFL, CFL, and Hugh” This one was really spoke to me. Incidentally, a lot of Canadians entered this contest. Is that a thing in Canada?
@seanale, “A little bit from column A, and A little bit from column B”
@jack_cade1450,”Friedman Tumescence vs. Proximity to Corporate Titan”
I was relieved to discover I wasn’t too old to find this funny:
11. @nbsorei’s “Self-reference graph” was a terrific idea, but I think he’s also the Zodiac killer (check out that handwriting)
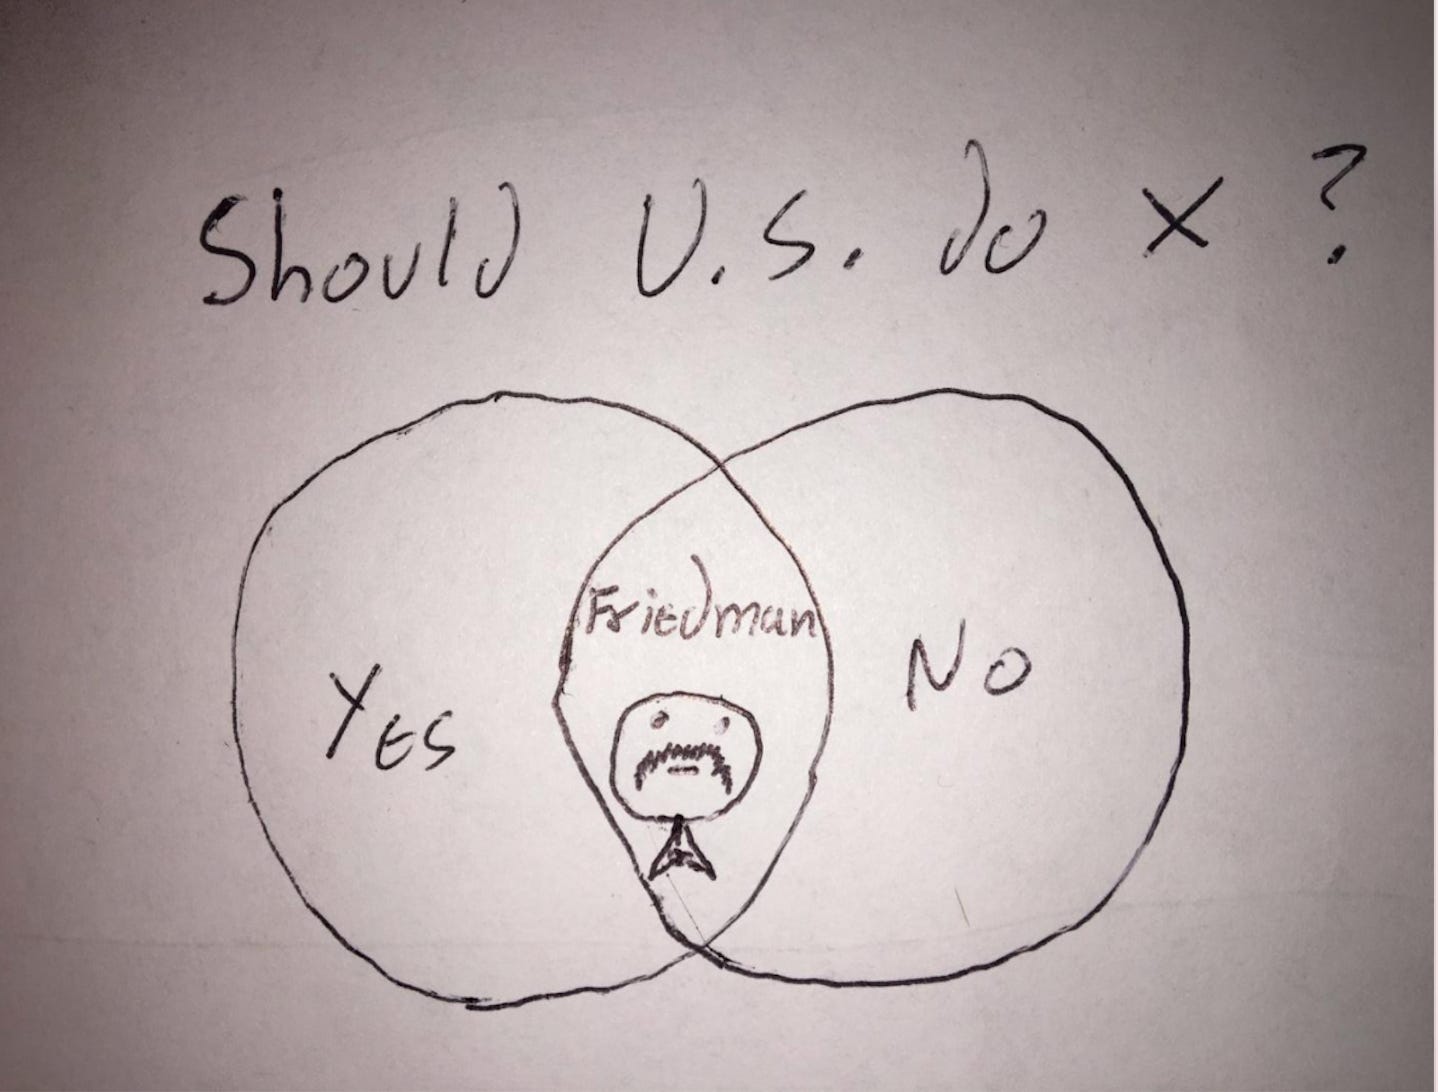
@fritzlodge, “Should America Do X” was the best Venn diagram:
@fitelson, “Amount of Relish, per ounce, vs. Degree of Nonsense, now and then, relished by the wisest men, vs. Frequency of Relish” might have been my favorite, a nonsense concept rendered with William Blake-ean flair:
Just for the record. I won’t clog your in-mail box with this, but if you want to look, it’s on the site.


it's the "United States" qualifier that absolutely makes that donut chart.
All so great! However, a complaint about #4, although it's brilliant, isn't this supposed to be about meaningless graphs?